Blogger edition published 13 October 2026. Original publication dates are preserved; the website import date is not used.
Historical article. Figures, holdings and views reflect the original publication, not current conditions. Claims are preserved, not independently revalidated. Capital at risk.
Executive Summary
True compounding requires structural liquidity, not accounting fiction. By isolating businesses with dominant cash conversion over reported accounting income, our portfolio generated a +27.87% return YTD and +126.13% since January 2024, significantly outpacing the broad market. In an economic regime where the 10-year US Treasury yield hovers near 5.0%, relying on standard income statements introduces severe balance-sheet vulnerability for investors blindly allocating to broad market indices.
[Insert Performance Chart Here]
The Flaw in Headline Accounting Metrics
Financial media coverage consistently anchors retail attention to EBITDA and GAAP Net Income. These metrics represent accounting abstractions that obscure physical capital movements.
EBITDA deliberately strips out depreciation and amortization—the exact line items that account for the maintenance and expansion of physical infrastructure. Today, a clear spread has opened between reported EBITDA growth and actual Free Cash Flow (FCF) conversion rates. While mid-cap technology vendors display paper profitability, their actual cash generation stalls.
Free cash flow conversion measures the exact percentage of operating income that converts into deployable, discretionary capital after funding physical operations and working capital:
FCF Conversion Rate = Free Cash Flow / Operating Income (EBIT)
When this ratio deteriorates, paper profits mask structural balance-sheet distress.
The Two Mechanics Distorting Net Income
1. The Capital Expenditure Depreciation Gap
Frontier compute expansion requires upfront liquidity. When hardware is deployed, cash leaves the treasury immediately. Under accrual accounting standards, that expenditure sits on the balance sheet and amortizes incrementally over three to five years.
This accounting lag inflates immediate earnings per share, hiding the immediate cash burden. When analyzing an income statement during an infrastructure cycle, participants evaluate the historical tail of prior spending rather than current capital commitments.
2. Stock-Based Compensation Dilution
Stock-based compensation (SBC) substitutes equity grants for payroll cash. While this preserves reported cash from operations, it introduces steady share count expansion.
The enterprise avoids a headline cash drain, but equity holders absorb the real cost through ownership dilution. Treating SBC-heavy businesses as high-margin operations ignores the ongoing cost paid directly by equity owners.
The 5% Cost of Capital Reality Check
When risk-free interest rates hovered near zero, poor cash conversion went unpunished. Enterprises bridged cash deficits by issuing low-coupon debt or raising equity rounds.
At a 5.0% cost of capital, that safety net disappears:
Low-Conversion Equities: Forced to issue expensive corporate debt to service capital expenditure programs, directly compressing forward margins.
Structural Monopolies: Possess near-instantaneous cash conversion, enabling full self-funding of large-scale infrastructure without entering credit markets.
Owning physical bottlenecks and infrastructure toll booths insulates capital from borrowing shocks. Companies with dominant market pricing power convert commercial activity directly into bank liquidity, rendering interest rate cycles irrelevant to their operational expansion.
How to mirror this portfolio:
Step 1: Search for razvancd on eToro.
Step 2: Click Copy and check "Copy Open Trades".
Step 3: Recommend a $500 minimum allocation.
Copy Trading is not investment advice | Capital at risk | Past performance does not guarantee future results.
eToro version · 13 October 2026
This published adaptation is preserved in full alongside the Blogger article.
Original eToro publication →
𝗘𝗱𝘂𝗰𝗮𝘁𝗶𝗼𝗻𝗮𝗹 𝗠𝗮𝘀𝘁𝗲𝗿𝗰𝗹𝗮𝘀𝘀: 𝗖𝗮𝘀𝗵 𝗖𝗼𝗻𝘃𝗲𝗿𝘀𝗶𝗼𝗻 & 𝗧𝗵𝗲 𝗜𝗹𝗹𝘂𝘀𝗶𝗼𝗻 𝗼𝗳 𝗔𝗰𝗰𝗼𝘂𝗻𝘁𝗶𝗻𝗴 𝗣𝗿𝗼𝗳𝗶𝘁𝘀
While retail investors chase accounting illusions and headline earnings, our portfolio demands structural cash generation—a discipline that has driven our +27.87% YTD and +126.13% return since January 2024. In a macroeconomic regime where the benchmark 10-year US Treasury yield sits near the 5.0% threshold, relying on traditional income statements is a severe vulnerability for participants blindly tracking broad indices like the $SPX500 or the $NSDQ100.
The financial media consistently misleads retail participants by anchoring analysis on Net Income or EBITDA (Earnings Before Interest, Taxes, Depreciation, and Amortization). These are heavily manipulated accounting metrics, highly susceptible to non-cash adjustments. They act merely as the architectural blueprint of a business, not the concrete foundation. Today, we observe a dangerous, widening spread between reported EBITDA growth and actual Free Cash Flow (FCF) conversion rates, particularly among mid-cap technology equities compared to the mega-cap platform monopolies like $MSFT, $GOOGL, and $AMZN.
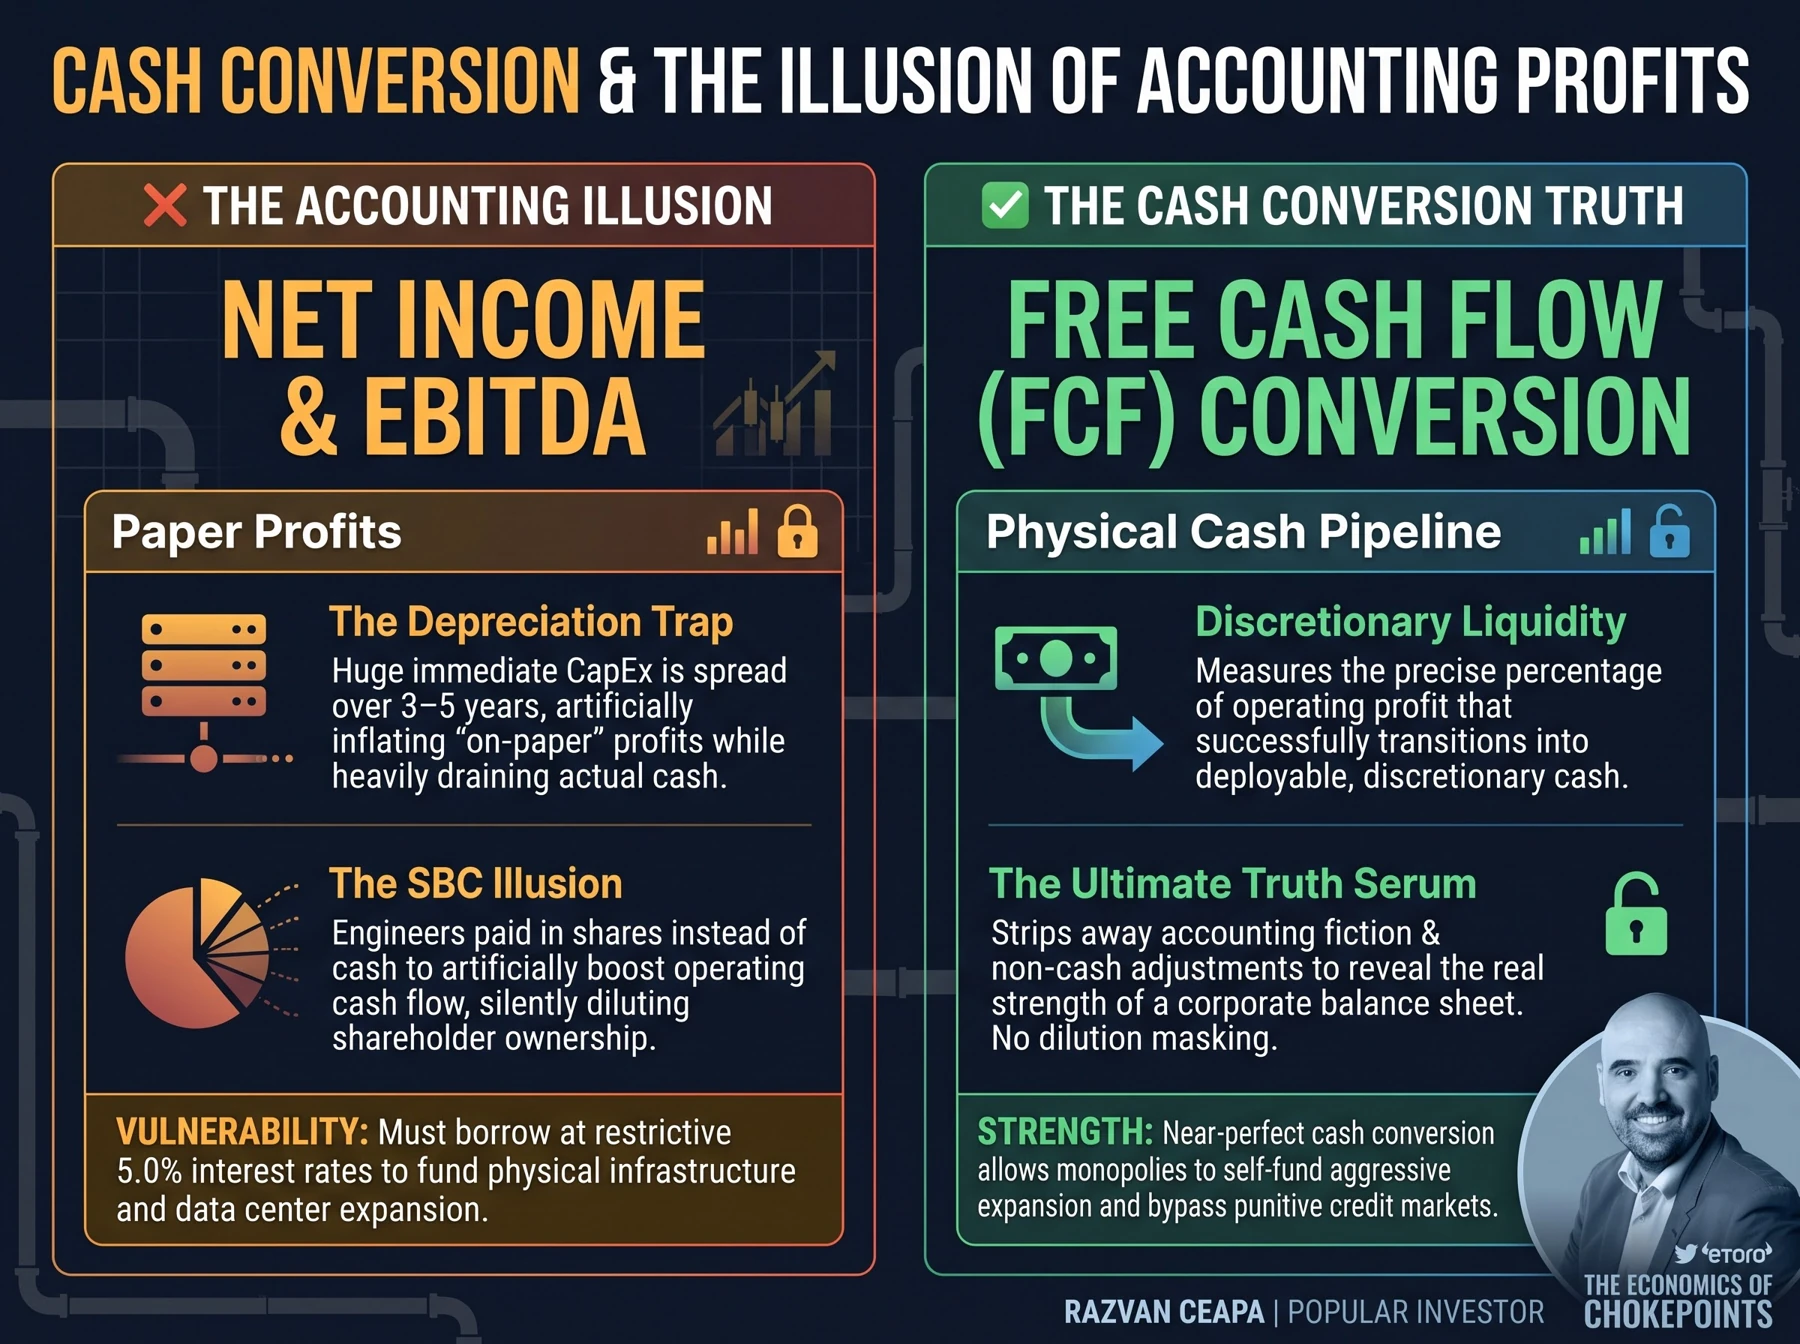
To manage capital like an institutional strategist, you must understand the exact mechanics of Cash Conversion. This metric measures the precise percentage of operating profit that successfully transitions into deployable, discretionary liquidity after a firm funds its physical operations and working capital requirements. It strips away the accounting fiction and acts as the ultimate truth serum for a corporate balance sheet.
Why do accounting profits deceive the market? The disconnect occurs primarily through two mechanisms: depreciation schedules and stock-based compensation (SBC).
• 𝗧𝗵𝗲 𝗗𝗲𝗽𝗿𝗲𝗰𝗶𝗮𝘁𝗶𝗼𝗻 𝗧𝗿𝗮𝗽: Consider capital expenditures (CapEx). When a technology company purchases servers or networking infrastructure, the cash leaves the bank account immediately. However, on the income statement, that massive expense is depreciated—spread out incrementally over three to five years. This accounting rule artificially inflates current net income, making the company look highly profitable on paper today, even though its actual cash reserves were heavily drained to procure the hardware. When you look at an income statement, you are looking at the ghost of past expenditures.
• 𝗧𝗵𝗲 𝗦𝗕𝗖 𝗜𝗹𝗹𝘂𝘀𝗶𝗼𝗻: Stock-based compensation allows companies to pay their engineers in shares rather than cash. This avoids a direct cash drain, boosting operating cash flow artificially, but it silently dilutes your ownership stake. The company pretends it is highly profitable, while you, the shareholder, foot the bill through equity dilution.
This brings us directly to the current macroeconomic environment. The digital economy is currently undergoing the most aggressive infrastructure build-out in modern history. Expanding hyperscale data centers requires billions in immediate, hard cash. A secondary technology company with poor cash conversion cannot self-fund this expansion. They are forced to enter the credit markets to issue debt at restrictive 5.0% interest rates, severely compressing their future margins and destroying shareholder alpha.
Conversely, structural monopolies command near-perfect cash conversion ratios. This is the bedrock of my "Economics of Chokepoints" investment thesis. We strictly allocate capital to the physical toll booths of the tech sector because their cash conversion allows them to act as their own central banks. They extract economic rents from the entire supply chain, instantly converting those revenues into deployable liquidity. They fund their multi-billion-dollar CapEx arms race entirely through internal operations, bypassing the punitive credit markets.
The fundamental lesson is clear: institutional capital does not buy accounting profits; it buys the physical cash pipeline. Isolate businesses with immense pricing power and ruthless cash conversion, and you mathematically insulate your capital from macroeconomic credit shocks.
𝗖𝗼𝗽𝗶𝗲𝗿 𝗕𝗹𝘂𝗲𝗽𝗿𝗶𝗻𝘁:
Click Copy to mirror this exact positioning. Check "Copy Open Trades". A $ 500 minimum allocation is recommended to ensure all fractional shares align perfectly to our targeted allocations.
Copy Trading is not investment advice | Capital at risk | Past performance does not guarantee future results.
Copy Trading is not investment advice | Capital at risk | Past performance does not guarantee future results.
Full disclosures.
 Executive Summary
